Yesterday I spent a large part of the afternoon getting debugging for PHP up and running on Atom editor. Although it turned out to be relatively simple in the end I did a lot of banging my head against stack overflow pages to get there, so here are the steps that worked for me.
System
My set up is as follows:
- Windows 10
- XAMPP Server version 3.2.1 running on locahost
- XDebug version (php_xdebug-2.5.0-5.6-vc11.dll)
- Atom version 1.12.6
Install XDebug
To set up PHP Debugging in the Atom editor you need to get XDEbug. I’m assuming you already have XAMPP and Atom installed. To get XDebug, go here and follow the instructions. This will ask you to paste in your phpinfo output and will recommend you an XDebug version to install. Then follow the install instructions it provides.
Install PHP-Debug
Next you need to install the PHP-Debug extension in Atom. Go to Atom > File > Settings and click on Packages. Then just type PHP-Debug in the search bar (mine is already installed):
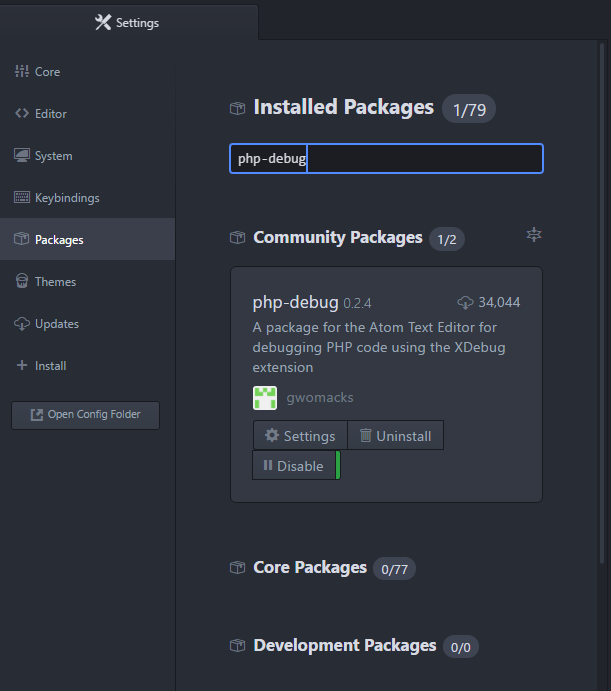
Just click on the install button and Atom will do the rest for you.
Breakpoints
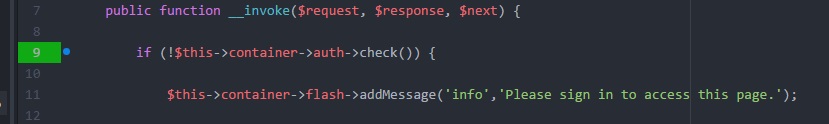
Now try setting a breakpoint – either click next to the line number you want to break on or right click and toggle breakpoint.
I had trouble setting breakpoints initially – they were getting set in the Breakpoints section of the PHP Debug console (Packages > PHP-Debug > Toggle Debugging):
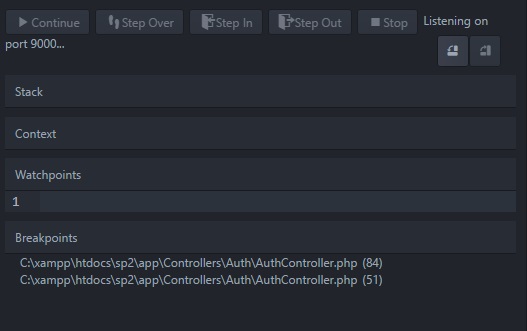
But the breakpoints in my code were not getting highlighted in green like they were supposed to be.
This seems to be related to path mapping. Since I am debugging code that resides on localhost, I didn’t think I needed to set up any configs for remote path mapping, however it proved necessary.
In PHP-Debug’s settings (File > Settings > Packages > PHP-Debug > Settings) there is a section on editing Atom’s config file, config.cson, however I had more luck with just putting these settings in the GUI (one reason being that I overlooked the escaping the backslashes in my Windows path).
Here are my settings for PHP-Debug:
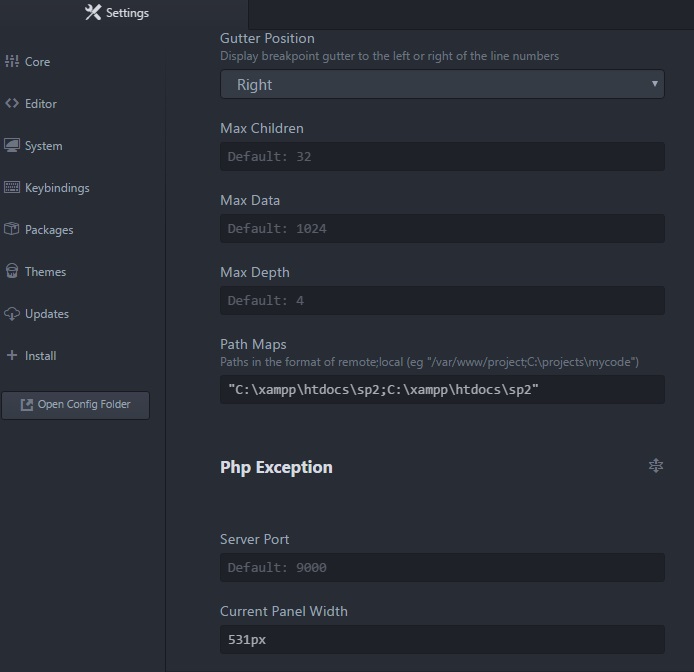
The path mapping settings are significant – both sides of the semicolon are the root of the project I am debugging. I tried a number of different combinations here but only this worked. All other settings are default.
My config.cson file now looks like this:
"*":

core:

telemetryConsent: "limited"

editor:

tabLength: 4

"exception-reporting":

userId: "5459b27c-48cc-ad55-9b2d-d0152d4a2d71"

"php-debug":

PathMaps: [

"\"C:\\xampp\\htdocs\\sp2;C:\\xampp\\htdocs\\sp2\""

]

currentPanelMode: "side"

currentPanelWidth: "531px"
Et voila! My breakpoints are now being highlighted in bright green, just like a highlighter!
XDebug Config for PHP-Debug
Some configurations need to be set in php.ini. Back in PHP-Debug’s settings (File > Settings > Packages > PHP-Debug):
- Click the Settings button.
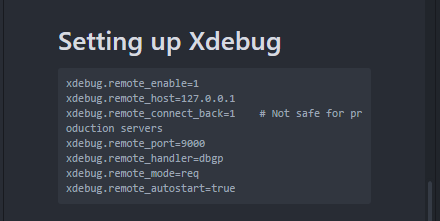
- Scroll down past all the settings to the README and then skip to the “Setting up Xdebug” section.
- There is a list of xdebug configurations that you need to put into your php.ini file – just copy and paste these straight in under the other commented out xdebug settings (tidy up later if you like).
XDebug Settings
IDEKey
I don’t know if this is strictly necessary if you use a browser plugin to run this (more below), but I have included an extra XDebug setting in my php.ini file which tells XDebug which IDE I’m using. The IDEKey for Atom is xdebug.atom, so add this to your php.ini:
xdebug.idekey=xdebug.atom
Integrating with XDebug
Now, you have two options here, the first being keeping xdebug.remote_autostart set to true and theoretically it should always be running and return control to Atom whenever PHP hits a breakpoint. This didn’t work for me at all, and I spent a lot of time trying to fix it before giving up and going with the second option of using a browser plugin to control all that.
So in your php.ini file set xdebug.remote_autostart to false.
xdebug.remote_autostart=false
Restart Apache
Remember to restart the Apache Server for those php.ini changes to take effect!
XDebug Browser Extension
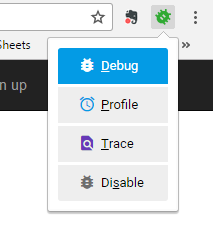
To start PHP Debugging in the Atom you need to install an XDebug browser extension – I’m using Chrome, so I’ve installed XDebug Helper
You’ll get a little bug button with a dropdown at the top of your browser:
Right click the bug button and select options:
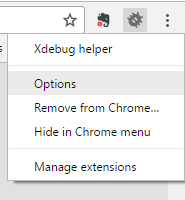
This will take you to the settings page.
XDebug Helper Settings
In the XDebug Helper Settings all you need to do is set the IDE key:
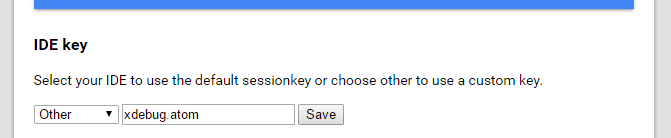
Select “Other” from the dropdown, set the IDE key value to xdebug.atom and click Save.
Running Debugging
Now you’re ready to run it all:
- In Atom, set a breakpoint and toggle debugging on. The debug console should say “Listening on port 9000…”
- In Chrome, navigate to the page you want to debug and turn debugging on in XDebug Helper. (debug bug turns green).
- Click whichever button starts your PHP script running
- XDebug should stop on your breakpoint, suspend the page and return control to Atom (note: Atom will not be sent to the front, you need to go back to it)
- Now you’re debugging!
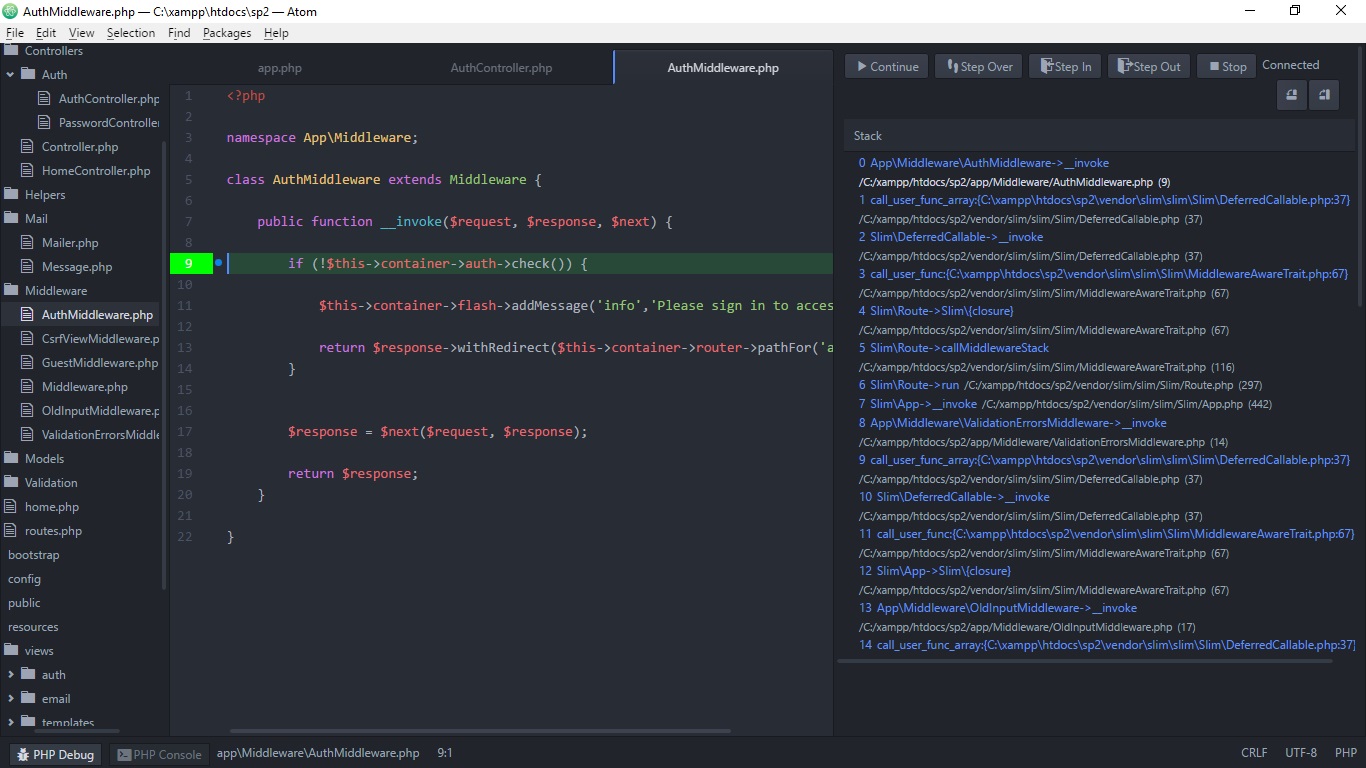
Now to track down that improbable bug in my code…